11 March 2026
EXECUTIVE SUMMARY
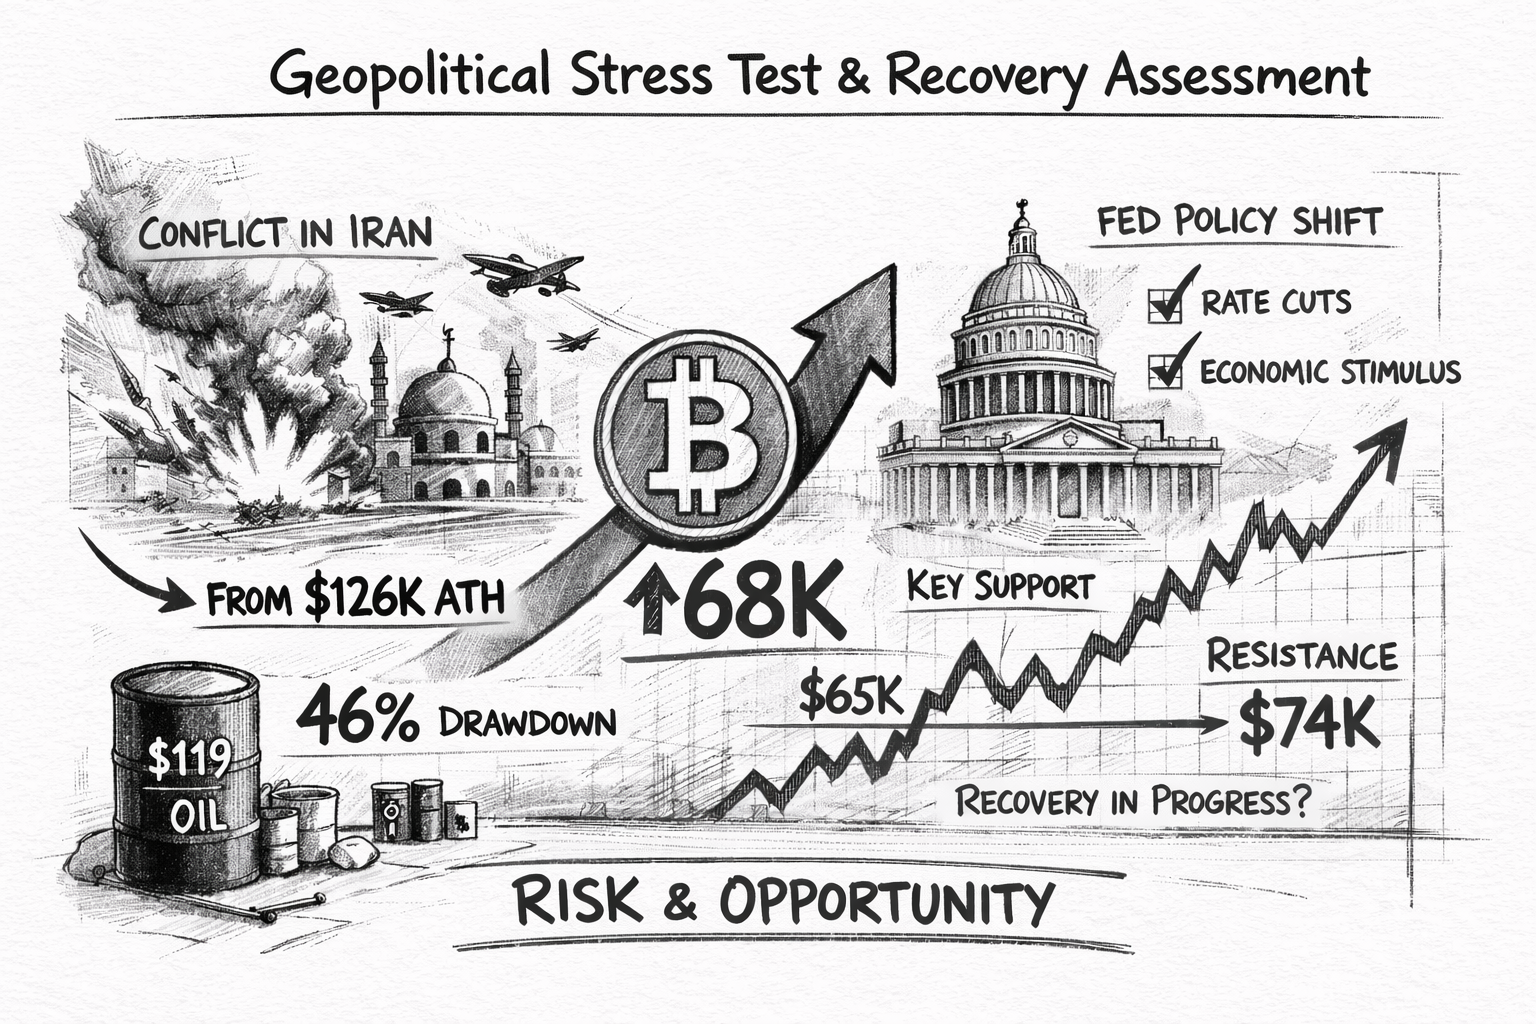
Bitcoin is trading near $68,000, down roughly 46% from its $126,000 October 2025 high, as the conflict that began with joint U.S.-Israeli strikes on Iran on 28 February enters its eleventh day. The initial shock sent BTC to $63,000; since then it has held a $65,000-$70,000 range through escalating oil prices and sustained Strait of Hormuz disruption. On March 9, Brent hit an intraday high of $119.50 before pulling back sharply as Trump said the war would end 'very soon,' announced U.S. Navy escorts for tankers through the Strait, and indicated oil sanctions on Russia may be waived to ease supply. Brent settled at $98.96 on Monday and fell further to approximately $94 on Tuesday as markets processed Trump's statements. BTC tested $65,000 overnight before recovering to $69,000 as oil fell.
This note examines whether on-chain structure, institutional flows, and price behaviour through an active geopolitical crisis constitute the early stages of a bottom, or a pause before further downside.
The weight of evidence supports a credible bottoming process. It does not yet support a confirmed recovery. The 200-day EMA sits roughly $22,000 above current price. Two competing signals define the current moment: Trump's de-escalation rhetoric and tanker escort commitment point toward Scenario 1 conditions improving, while Iran's appointment of Mojtaba Khamenei as new Supreme Leader, a 56-year-old hardliner with deep IRGC ties who was already sanctioned by the U.S., signals Iran has no intention of negotiating quickly. February payrolls showed a loss of 92,000 jobs. Brent at approximately $94 is well off the $119.50 peak but still far above the $75 threshold that would materially ease Fed communication constraints. We identify $65,000 as critical support and $74,400 (50-day EMA) as the first overhead level that matters.
1. GEOPOLITICAL CONTEXT: THE IRAN STRESS TEST
1.1 Event Chronology and Initial Market Impact
The U.S.-Israeli strike on Iran on 28 February 2026 landed on a Saturday, when Bitcoin was the only major liquid market open. It absorbed the initial shock alone. Eleven days in, the conflict has produced the largest single-day oil spike since at least 1988, a partial reversal on Trump de-escalation signals, and the appointment of a hardline new Iranian Supreme Leader who has given no indication of willingness to negotiate. Two competing forces are operating simultaneously and the market is pricing both.
1.2 Interpreting the Resilience Signal
Bitcoin holding a $63,000-$70,000 range through eleven days of this conflict can be read two ways.
The bullish read: Marginal sellers are largely exhausted after a 46% drawdown. The market absorbed roughly $300M in long liquidations and recovered. ETF holders did not panic-sell; total Bitcoin ETF AUM fell only 6% despite a 50% price decline from October highs to the February low. BTC dipped to $65,000 overnight on March 9 as oil opened near $120, then recovered to $69,000 as Brent fell back. The floor held on the worst session of the conflict.
The cautious read: Bitcoin is behaving as a risk asset. Its 30-day Pearson correlation to the Nasdaq Composite reached 88% as of March 6 per The Block. Gold surged to $5,388/oz while BTC held. The debasement trade continues to diverge. Iran's new Supreme Leader, Mojtaba Khamenei, is a 56-year-old hardline cleric with deep IRGC ties who was sanctioned by the U.S. in 2019; his appointment signals Tehran has no intent to negotiate on Trump's terms. Trump says war will end 'very soon' but told reporters he does not expect it over this week.
Brent hit $119.50 intraday on March 9 before Trump's afternoon press conference reversed the move. Brent settled Monday at $98.96 and fell further to approximately $94 on Tuesday as markets processed his de-escalation signals. The oil-inflation-Fed pressure has eased from its peak but Brent at $94 is still far above the $75 threshold that would materially change Powell's communication options on March 18.
1.3 The Oil Escalation and New Leadership Risk
The re-inflation narrative hardens when Brent sustains above $80 for multiple sessions. Brent hit $119.50 intraday on March 9, its largest single-day gain since at least 1988. Trump's Monday afternoon statements, including an announcement of U.S. Navy escorts for tankers through the Strait and a signal that Russia oil sanctions may be waived to ease supply, pulled Brent back to $98.96 by the close. By Tuesday it had fallen to approximately $94.
The supply disruption remains intact. Qatar declared Force Majeure on gas contracts March 4. Iraq's output is down roughly 60% as unexportable barrels fill storage. Saudi Arabia has now confirmed production cuts as the Strait closure backs up storage across the Gulf, per Bloomberg. Iran struck U.S. military facilities in the UAE and the conflict has extended toward Lebanon. Only three Strait crossings were recorded on March 7 against a normal daily baseline above 50. More than 3,200 vessels are idle in the Gulf, with a further 500 waiting in UAE and Oman waters per Clarksons Research. Maersk, CMA CGM, and Hapag-Lloyd have suspended all Hormuz transits.
Neil Atkinson, former head of oil at the IEA, told CNBC the effective closure is something energy markets had never seen before. Helima Croft of RBC Capital Markets called it 'what looks like the biggest energy crisis since the oil embargo in the 1970s.' ExxonMobil chief economist Tyler Goodspeed told CNBC that when assessing the probability distribution of outcomes, the scenario in which the Strait remains 'effectively closed harder for longer' is significantly more probable than the scenario of normalised passage. Trump's verbal intervention pulled Brent approximately $21 from its intraday peak by Monday's close. The physical supply chain has not changed.
The key new risk factor is Iran's leadership transition. Mojtaba Khamenei, selected by the Assembly of Experts on March 8 under IRGC pressure, holds views described as more hardline than his late father's and now controls Iran's armed forces and nuclear programme decisions. Israel has threatened to target him. Trump said any new supreme leader who continues Iranian military activity 'is not going to last long.' This is not a leadership transition that points toward near-term negotiation. It increases the probability that the Strait closure extends well beyond the one-to-two week timeframe markets initially assumed.
The February payrolls report, released March 6, showed the U.S. economy shed 92,000 jobs against a +59,000 forecast, with December revised to -17,000. Oil-driven inflation alongside a contracting labour market is the combination the Fed has least room to navigate. With Brent at $94 still representing roughly 35% above pre-conflict levels, the stagflationary setup for the March 18 meeting is not resolved. Polymarket prices a 41% probability of a U.S. recession in 2026.
2. TECHNICAL STRUCTURE & KEY MOVING AVERAGES
2.1 EMA Resistance Ladder
Bitcoin trades below all four primary exponential moving averages. They sit in a descending stack, which is what a bear market looks like. Reclaiming them sequentially is the recovery path:
2.2 Price Range and Pattern
The $65,000-$70,000 range has now held for five weeks, through the initial Iran shock, a brief dip to $60,445 in late February, and a short-covering squeeze toward $72,000-$74,000. Five weeks in the same band after a 46% drawdown is not nothing.
The $60,445 spike low on heavy volume left a long lower wick. That is what it looks like when sellers run out rather than continue distributing. A descending trendline from November 2025 highs near $130,000 has capped every rally; it currently sits near $70,000-$72,000. A break above $74,000-$75,000 with volume would matter: that zone is where options max pain and high open interest converge, and a sustained breach would force short-covering. The downside risk is not negligible. A bearish flag on the 8-hour chart, if confirmed with volume below lower support, targets the $55,000 area. That path becomes more likely if oil stays above $100 into the Fed meeting and the March 18 statement is explicitly hawkish.
3. ON-CHAIN METRICS & DERIVATIVES POSITIONING
The on-chain and derivatives data sits in unusual territory. Several of these readings have appeared only at prior cycle lows. None of them are independent of the macro conditions in Sections 1 and 6.
One clarification on the Fear and Greed reading: the February low of 5, recorded on February 6, predates the Iran strikes and was tied to the $60,445 price level. It is the lowest reading on record since the index launched in 2018. The index recovered to 18 by March 6 before sliding back to Fear territory on March 9 as oil hit $119.50. That the index did not return to Extreme Fear during the worst oil session of the conflict suggests the baseline of retail panic has shifted slightly since February.
4. INSTITUTIONAL FLOWS: ETF DATA
4.1 The Flow Reversal
After five consecutive weeks of institutional outflows totalling approximately $4.5 billion, spot Bitcoin ETF flows reversed in the last two weeks. Bloomberg's James Seyffart noted that the prior outflow period saw 'basically no dip buying when bitcoin was a falling knife.' The week ending March 6 produced $568.45M in net inflows, a $1.15B buying wave over three days (March 2-4) partially offset by $576M in combined Thursday-Friday outflows. Total U.S. spot Bitcoin ETF AUM stands at approximately $87 billion.
4.2 Structural Context
Despite a 50% drawdown from October highs, total Bitcoin held in U.S. ETFs declined only 6%. The ETF holder base has not been a source of reflexive selling.
The most constructive signal in the flow data remains the $458M of ETF inflows on March 2 running concurrently with deeply negative funding rates: institutional buyers accumulating at the same time retail was net short. Morgan Stanley's SEC filing for a spot Bitcoin ETF adds a demand channel not yet reflected in price. The firm has among the largest financial advisor networks in the U.S., and if it distributes the product actively the addressable buyer pool expands materially.
The pattern of large daily inflows followed by sharp reversals within the same week is the risk. The three-day $1.15B buying streak ending March 4 gave back $576M in two days. The oil shock to $119.50 on March 9 with the accompanying equity sell-off created conditions where further near-term outflows are plausible; March 9-10 flow data is not yet confirmed. Two positive weeks is a structural signal that the outflow regime has ended; it is not yet confirmation that sustained institutional accumulation has begun.
5. FED NET LIQUIDITY: THE STRUCTURAL BACKDROP
Fed net liquidity, the Federal Reserve's balance sheet (WALCL) minus the Treasury General Account (TGA) minus the Overnight Reverse Repo (RRP), measures the volume of reserves actually available to financial markets. It is a more direct transmission variable for risk assets than the federal funds rate, and it is what most short-cycle analysis overlooks.
Three things changed in Q4 2025. The Fed ended quantitative tightening on December 1, having drained roughly $2.2-2.4 trillion from its balance sheet since June 2022. The balance sheet stabilised at approximately $6.6 trillion. The RRP, which peaked above $2 trillion in 2023, drained to effectively zero as money market funds rotated into higher-yielding instruments. On December 12, the New York Fed began $40 billion per month in reserve management purchases, buying short-term Treasuries to maintain ample reserve conditions. Arthur Hayes and others have characterised this as structurally equivalent to earlier QE programmes.
Net liquidity stands at approximately $5.7 trillion as of February 11 (GuruFocus/FRED), down 3.66% year-over-year but stabilising. Direction matters more than level here. Bitcoin fell when net liquidity contracted sharply in 2022-2023. It rallied when liquidity stabilised and recovered in late 2023. The end of QT is a tailwind that functions without rate cuts.
The oil shock complicates this near term. Brent at $94 after pulling back from $119.50 still represents roughly 35% above pre-conflict levels and well above the $75 threshold where the re-inflation pressure materially eases. If Trump's de-escalation signals translate into genuine Strait reopening and Brent retreats below $80, the path toward active easing reopens. Until then, the QT tailwind is functioning but the ceiling question is unresolved. What is not in doubt is the floor: no mechanism exists by which an oil shock restarts balance sheet contraction. A Fed frozen between an oil shock and softening employment is not tightening. That distinction matters for Bitcoin's support level even when it limits the near-term ceiling.
6. MACRO CATALYST: THE 18 MARCH FED DECISION
The March 18-19 FOMC meeting is the most important near-term binary for Bitcoin. Brent at $94, down from $119.50 but still roughly 35% above pre-conflict levels, keeps the re-inflation argument alive going into the meeting. CME FedWatch prices a 94.1% probability of a hold, with 5.9% on a 25bp cut. The February payrolls print of -92K against a +59K forecast puts the Fed in stagflation territory: cutting into a commodity shock is not standard policy, and holding with explicit hawkish language while unemployment rises toward 4.4% is also uncomfortable. Brent's pullback from $119.50 to $94 on Trump's verbal intervention gives Powell marginally more room to characterise the oil spike as temporary without being contradicted by the pump price on the day he speaks.
The decision will almost certainly be a hold. What matters is how Powell frames it. A hold that treats the oil spike as a temporary supply disruption, which the Brent pullback from $119.50 to $94 makes slightly easier to argue, leaves late-2026 cut expectations roughly intact. A hold with explicit citation of energy-driven re-inflation signals those cuts are off the table. With Mojtaba Khamenei now in control of Iran's armed forces and no public signal of willingness to negotiate, Trump's 'very soon' framing may prove optimistic. The Strait physical closure continues even as oil prices have corrected. Powell will be watching the same data.
7. RECOVERY SCENARIO FRAMEWORK
Scenario 1 requires a Strait reopening as its necessary first condition. Trump's Navy escort announcement and 'very soon' framing have moved the probability of that happening in the next two to four weeks from near-zero to something the market is beginning to price. The appointment of Mojtaba Khamenei works in the opposite direction. Scenario 2 is now the most consistent description of the current oil range; Brent at $94 after pulling back from $119.50 sits near the top of the $80-95 band in that scenario. Scenario 3 requires oil to reaccelerate above $100 and hold.
8. RECOVERY CONFIRMATION CHECKLIST
Eight conditions ordered by priority. None of the lower items on this list matter until the higher ones are met.
9. CONCLUSION
On March 9, Brent hit $119.50 intraday, Asian equities fell 5-8%, the VIX rose to 31.19, and S&P 500 futures dropped 1.6%. Bitcoin tested $65,000 and did not close there. It recovered to $69,000 as oil reversed and is trading near $68,000 on March 10. The $65K support held on the worst macro session of this conflict. That is the central datapoint.
The structural signals remain intact. Weekly RSI at 27.48, only the third reading below 30 in Bitcoin's history; the prior two instances in January 2015 and December 2018 both marked major cycle lows per checkonchain and CoinDesk. Whale addresses netted roughly 270,000 BTC in 30 days, the largest accumulation pace in 13 years per Glassnode. Exchange reserves at a six-year low. ETF inflows positive for two consecutive weeks. Funding rates peaked at -6% and are normalising. BTC's 30-day Pearson correlation to the Nasdaq reached 88% per The Block as of March 6, which is the bearish asterisk: this is still a risk-asset correlated market, not a safe-haven one.
Two competing forces now define the near-term path. Trump's Navy escort commitment, Russia sanctions waiver signal, and 'very soon' language represent the first concrete U.S. policy steps pointing toward Strait reopening. Brent falling from $119.50 to $94 in under 24 hours shows how quickly the oil premium can compress on de-escalation signals. The counterforce is Mojtaba Khamenei. The 56-year-old IRGC-aligned cleric has never negotiated publicly, was already sanctioned by the U.S. in 2019, and was selected under IRGC pressure specifically to prosecute the war. Israel has threatened to target him. Trump says any leader who continues Iranian military activity 'is not going to last long.' That is not the framing of an imminent deal.
The net liquidity backdrop provides the structural floor that prior cycles lacked. QT ended December 2025. The RRP has drained to zero. Reserve management purchases are running at $40 billion per month. A Fed frozen between an oil shock and softening employment is not tightening. Brent retreating from $119.50 to $94 marginally improves Powell's ability to characterise the oil spike as transitory on March 18, though the physical Strait closure continues regardless of the price.
ASSESSMENT: CREDIBLE BOTTOMING, RECOVERY UNCONFIRMED. $65K HELD ON THE WORST SESSION OF THE CONFLICT. TWO COMPETING FORCES NOW ACTIVE: TRUMP DE-ESCALATION VS. HARDLINE NEW IRANIAN LEADERSHIP.
$65K held through a $119.50 oil spike, a 31.19 VIX reading, and 5-8% equity declines across Asia. The accumulation data is intact. The floor thesis has now been stress-tested more severely than at any prior point in this cycle and has not broken.
Key upside condition: credible Strait reopening signals in the next week, with Brent sustaining below $90, combined with neutral Fed language on March 18, would move Scenario 1 back into view. Trump's Navy escort commitment is a partial catalyst; the 50-day EMA at $74,400 is the first technical level to clear. Key downside condition: Mojtaba Khamenei ordering escalatory strikes that push Brent back above $100, accompanied by hawkish Fed language and a daily close below $65K, would put the floor thesis under serious pressure. The two forces will resolve in one direction or the other in the next one to two weeks.