TLDR
The debasement trade dominated 2025 with results that should force a reassessment of crypto's place in macro portfolios.
Gold posted its strongest year since 1979, gaining 65% to close near $4,310 per ounce, then extended gains into January 2026 by breaking above $5,000 for the first time.
Silver did even better, surging 140% for its best performance in 46 years before accelerating further in January with a parabolic move driven by physical demand and inventory tightness.
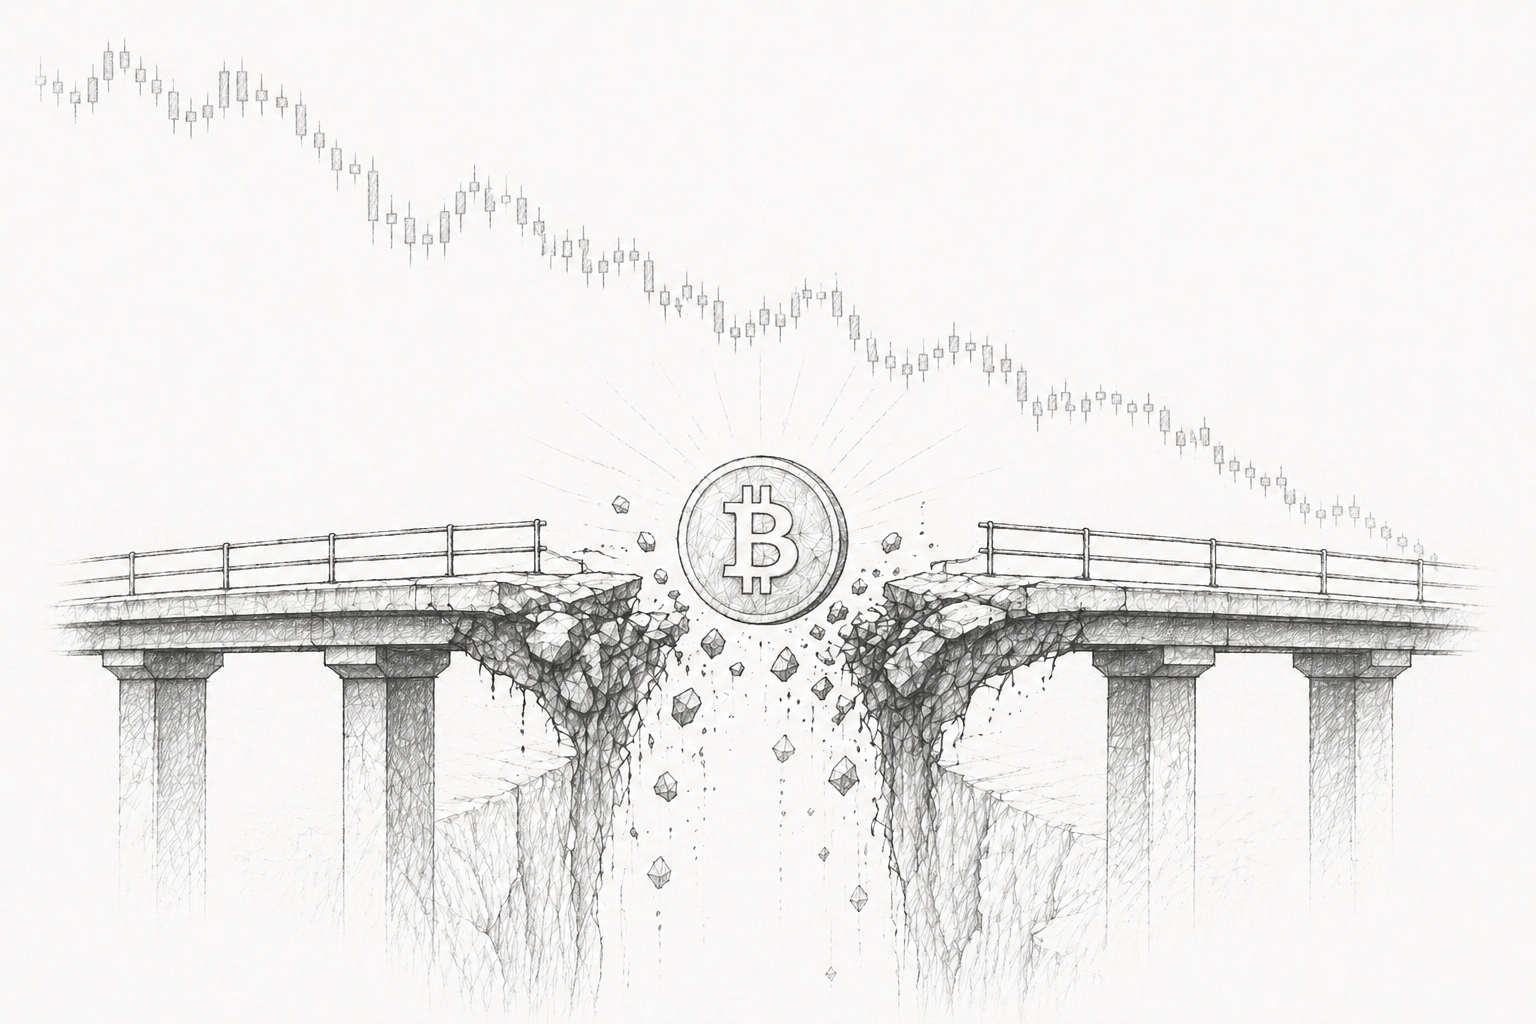
Meanwhile, Bitcoin fell 6.3% in 2025 and has barely moved in January, despite sharing the same monetary debasement thesis that supposedly underpins its value proposition.
Every condition that Bitcoin bulls cite as bullish materialized, and Bitcoin still underperformed cash. The "digital gold" narrative broke down precisely when it should have worked.
Before drawing conclusions, an important framing question must be addressed: is Bitcoin meant to hedge garden-variety debasement, or tail-risk regime change?
This analysis examines both framings.
The Setup: Why 2025 Should Have Been Bitcoin's Year
The debasement trade refers to positioning in assets that preserve purchasing power when central banks expand money supply through balance sheet expansion, persistent fiscal deficits, and currency devaluation. Traditional beneficiaries include gold, silver, and commodities. Bitcoin was supposed to join this list as "digital gold."
On December 10, 2025, the Federal Reserve announced it would begin purchasing Treasury securities at $40 billion per month. The Fed calls these "reserve management purchases" rather than QE, but the mechanical effect is identical: expanding the monetary base while inflation sits at 3%, still above the 2% target. The Fed justified this as a technical adjustment to maintain "ample reserves" after repo market stress emerged in autumn 2025.
Skeptics note that purchasing $40 billion monthly in Treasuries while running trillion-dollar deficits looks a lot like deficit monetization regardless of what you call it.
The fiscal backdrop compounds the thesis. U.S. federal net interest costs exceeded $1 trillion annually for the first time in FY 2025 (CRFB, Peterson Foundation). Debt-to-GDP sits north of 100%.
The CBO projects deficits averaging $2 trillion annually through decade-end. The dollar had its worst year since 2017, falling 9.6% on the DXY index.
This is not a U.S.-specific phenomenon. Governments globally are running massive and persistent deficits, creating coordinated debasement pressure across major currencies.
The Winners: How Precious Metals Captured the Trade
Gold set over 50 all-time highs through year-end 2025 (World Gold Council). Central bank accumulation remained the structural driver. When the People's Bank of China, the National Bank of Poland, and dozens of other central banks accumulate gold at record pace while prices hit all-time highs, they signal conviction that justifies paying up.
This official sector validation matters for institutional portfolio construction in ways that benefit no other alternative asset.
Investment demand surged across channels: APMEX, JM Bullion, and the Perth Mint all reported record volumes. Rate cut expectations supported valuations as lower yields reduce gold's opportunity cost. Geopolitical risk (Venezuela, Middle East, Fed independence concerns) added a persistent bid.
Gold gaining 18% in January alone, after a 65% year, signals that institutional and sovereign buyers are not waiting for pullbacks. They are paying up for exposure, which typically indicates strong conviction about the direction of monetary policy.
Silver's January surge reflects a physical scramble for metal. Chinese demand has intensified with Shanghai premiums at extremes, and inventory levels have fallen to critical levels.
The rally echoes 1979-1980, albeit without the concentrated manipulation.
Silver's outperformance also reflects its hybrid nature as monetary metal and industrial commodity. Supply deficits have persisted for five consecutive years, with the market short 160 to 200 million ounces annually.
Unlike gold, most silver production comes as a byproduct of other mining, meaning supply cannot respond quickly to higher prices. Mexico, the world's largest producer, saw output decline 4 to 6% amid regulatory changes (GlobalData, INEGI), and Russian sanctions created additional disruptions.
Industrial demand from solar panels, EVs, and AI data centers continues growing; the Silver Institute estimates industrial consumption exceeded 36,000 metric tonnes in 2025.
The gold-to-silver ratio collapsed from over 100 in early April 2025 to around 46 currently.
The Puzzle: Why Bitcoin Missed the Rally It Was Made For
Bitcoin began 2025 at $93,425 and ended at $87,509, a loss of 6.3%. The cryptocurrency did hit an all-time high of $126,198 on October 6, but gave back all those gains and more in the final quarter.
As of January 27, 2026, Bitcoin trades around $88,700, essentially flat for the month while gold gained 18% and silver gained 51%.
This marks Bitcoin's first negative year since 2022.
The factors driving this divergence fall into structural factors (persistent regardless of cycle) and cyclical factors (specific to 2025).
Bitcoin's annualized volatility ran 52-54% in 2025 vs gold's 15-17% (BlackRock/iShares, NYDIG). For institutional allocators with risk budgets, an asset that can lose more in a month than the debasement it hedges over a year presents a fundamental problem.
The spot Bitcoin ETF approvals brought ~$21 billion in inflows during 2025 (cumulative since January 2024: ~$57 billion), but institutional adoption means Bitcoin now trades according to portfolio rules: when risk budgets tighten, the small, volatile position gets trimmed first.
The 60-day BTC/Nasdaq correlation averaged 0.4-0.5, spiking to 0.7+ during stress (CME Group), while gold's correlation averaged near zero and turned negative during drawdowns (World Gold Council).
During Q1 2025, Bitcoin fell 31.7% while gold gained 33%, a 65-percentage-point divergence (CNBC, LiteFinance, LBMA).
The April 2024 halving reduced block rewards from 6.25 to 3.125 BTC. Historical patterns suggest halving effects operate on a 12-18 month lag, placing a potential rally in the April-October 2025 window.
That window passed without a sustained rally, suggesting the effect is either delayed or diminishing as Bitcoin's market structure matures.
The countervailing signal: exchange balances declined (indicating accumulation) and stablecoin market cap grew 52% to $311 billion, representing dry powder that remained parked rather than rotating into Bitcoin.
The Steel Man: What If Bitcoin Bulls Are Right?
The 2020 Precedent
In March 2020, Bitcoin crashed 50% alongside risk assets, then rallied over 300% in the subsequent twelve months as the Fed's balance sheet exploded from $4T to $9T (gold gained only 25%).
The lag was roughly two months; if similar, a rally might not begin until February or March 2026.
But the structural differences suggest any response may be smaller and slower.
One year does not invalidate a multi-decade thesis
The "digital gold" thesis is a claim about structural properties (fixed supply, censorship resistance, portability), not twelve-month returns.
Gold itself was a poor inflation hedge in the 1980s and 1990s, losing value in real terms for two decades; its modern safe-haven status took generations to establish.
Bitcoin has existed for fifteen years. This cuts both ways: the sample size for Bitcoin's behavior during major Fed easing cycles is exactly two (2020 and 2025), and they tell opposite stories.
The framing problem
If Bitcoin's value proposition is regime change insurance rather than garden-variety debasement hedging, then 2025 was not a test of the thesis. Debasement in 2025 was controlled, gradual, and institutionally managed. Gold thrives in that environment.
Bitcoin's unique properties (seizure resistance, borderless transfer, censorship resistance) become valuable in a different scenario: capital controls, currency crises, or confiscatory policies. None materialized in 2025. Under this framing, comparing Bitcoin to gold in 2025 is like comparing fire insurance to flood insurance during a flood year.
The risk is that this framing becomes unfalsifiable.
The thesis would only be falsified if a genuine regime-level crisis occurs and Bitcoin fails to outperform gold, or if Bitcoin's unique properties become compromised through regulatory action, or if over a full market cycle (7-10 years) including at least one regime-level stress event, Bitcoin fails to outperform gold on a risk-adjusted basis. Until then, the thesis remains untested rather than validated.
Three Scenarios for 2026
Scenario 2 is the current trajectory, and the most likely outcome in the near-to-mid-term based on extant factors.
Scenario 3 is lowest-likelihood because it requires multiple conditions to reverse simultaneously, and the structural fiscal deterioration in major economies makes sustained dollar strength difficult.
Key Indicators to Watch
Current readings: BTC/Gold at 17.5 oz is closer to the bearish threshold than the bullish one.
Gold ETF inflows continue while Bitcoin ETF flows have been mixed.
BTC/Nasdaq correlation remains elevated.
The Verdict
The debasement trade is real and unfolding as theory predicts. Precious metals responded immediately. Bitcoin's failure to participate clarifies its conditionality: it hedges regime instability, not garden-variety debasement.
Precious metals won 2025 because they were the right tool for the current phase. Bitcoin may prove right for a later phase that has not arrived. The risk is that phase never arrives, or arrives only after prolonged underperformance destroys confidence in the thesis.
Anyone claiming certainty is overconfident.